
Unleashing the Power of Data: Introducing the enhanced Sweet Performance Dashboard
We live in a world driven by data. But let’s be honest, data is only as valuable as the insights it provides. At Sweet, we understand the importance of transforming data into actionable insights that drive informed decisions and drive your organization forward. That’s why our customers always ask us to customize charts and dashboards for them – until now. How is that possible?
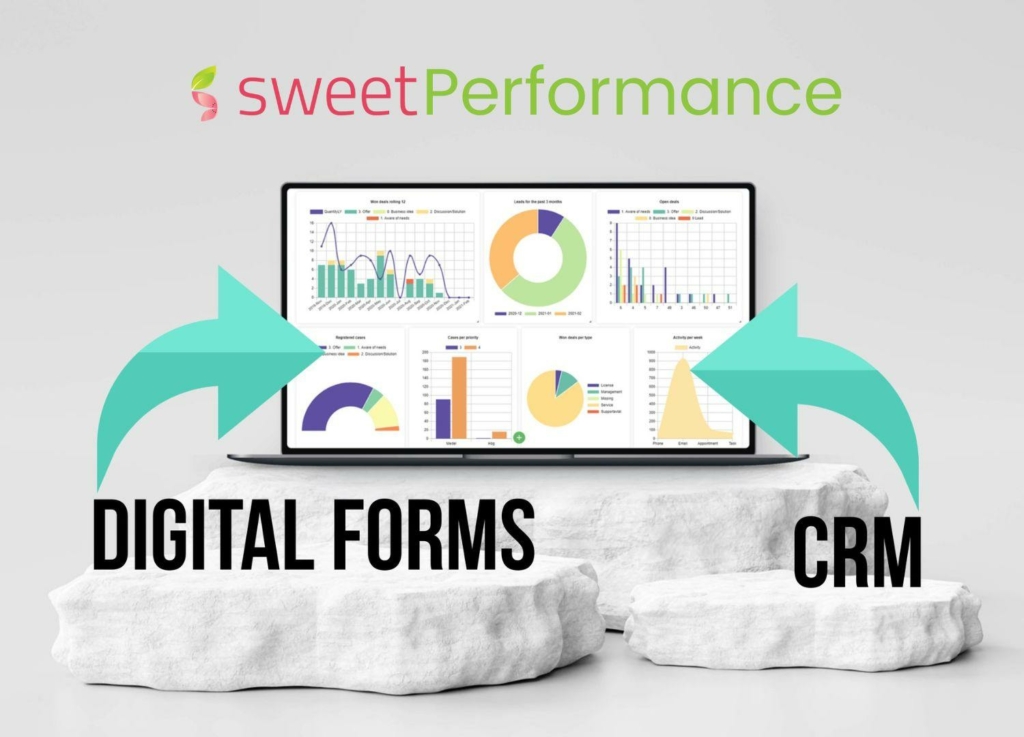
Today, we are thrilled to unveil the latest release of Sweet Performance – our game-changing dashboard tool designed to empower you with data insights like never before. With Sweet Performance, you can create your own customized charts and dashboards, seamlessly connected to Sweet CRM, Sweet Digital Forms, and your integrations in Sweet Automation.
We differentiate ourselves from the big BI masters like Power BI or Tableau by offering a more lightweight and user-friendly tool that focuses on providing you with the necessary visualization capabilities while maintaining flexibility. Our goal is to ensure that you, yes you, can easily create and modify visualizations to meet your evolving needs. Getting started is effortless, and our tool allows for seamless evolution as your requirements change over time.
Building Your Custom Dashboards
Gone are the days of relying on pre-built dashboards that don’t quite fit your needs. Sweet Performance puts you in the driver’s seat, allowing you to build custom charts and dashboards to meet your requirements and preferences. No coding or technical expertise required, meaning you can do it yourself!
Unified Data Source for Enhanced Efficiency
We understand the challenges of dealing with fragmented data across various platforms. That’s why Sweet Automation integrates your CRM, digital forms, and multiple other integrations, bringing all your data together in one unified source. Say goodbye to data silos and hello to a seamless data experience.
Effortless Usability that’s Empowering Everyone
You don’t have to be a business intelligence expert to leverage the power of Sweet Performance. Our user-friendly dashboard tool simplifies the process, making it accessible to users of all skill levels. With an intuitive drag and drop interface, you can effortlessly design and customize your dashboards, bringing all the pieces of your data puzzle together. On top of that, you can style the dashboards your way so that you can share the insights in line with your branding.
Share and Collaborate: Amplify Your Insights
Knowledge is meant to be shared, and with Sweet Performance, you can easily share your dashboards with relevant stakeholders or even showcase them as part of your Sweet CRM. Collaborate seamlessly, empower your team, and distribute your knowledge across your organization.
Unlock the Full Potential of Your Data
With Sweet Performance, you gain comprehensive insights into your business. Track sales performance, monitor customer interactions, and design visually stunning dashboards that provide a holistic view of your organization. The power to harness the full potential of your data is now at your fingertips.
Läs mer om samtliga funktioner här.
Explore the Possibilities
Are you ready to take your data visualization to the next level? Contact us today and discover how Sweet Performance can transform your data into actionable insights. Learn more about the latest updates and enhancements in our release notes, providing a detailed overview of the exciting features and improvements.
At Sweet, we believe that data should be your ally, not a burden. Let us empower you to make informed decisions, gain understanding of your organization and customers, and propel your business forward.
Unlock the power of data with Sweet Performance. Start building your custom dashboards today!
